2026 Cyber Claims Study: What 10,309 Claims Reveal
Every year, the NetDiligence® Cyber Claims Study strips away the guesswork around cyber risk and replaces it with something harder to argue with: real claims data. The 16th annual edition, drawing on 10,309 cyber insurance claims from incidents occurring between 2021 and 2025, continues that tradition — and this year’s numbers tell a story about concentration, escalation, and just how costly the worst-case cyber incident can become.
Sponsoring this year’s study are RSM, Experian, Surefire Cyber, and Constangy, Brooks, Smith & Prophete, LLP.
[Download the full 2026 Cyber Claims Study →]
SMEs Drive Claim Volume, Large Companies Drive Cost
Small and medium enterprises (SMEs) — organizations with less than $2 billion in annual revenue — account for 97% of all claims in the dataset. Large companies make up just 3%. Yet those large companies are responsible for 56% of the $5.65 billion in total incident cost analyzed.
It’s a gap that has persisted for years, and if anything, it’s still widening: the average large company in this year’s dataset is nearly 100 times the size of the average SME, and outsized losses at the top follow that scale. Twelve claims in this year’s dataset exceeded $100 million; the single largest topped $500 million.
Ransomware and BEC Are Still the Biggest Drivers of Loss
Ransomware and business email compromise (BEC) remain the two dominant causes of cyber insurance loss, and 2025 pushed that dominance further than we’ve seen before. Across the full five-year window, ransomware and BEC together accounted for 51% of SME claims of at least $1,000 — but in 2025 alone, that share jumped to nearly 61%.
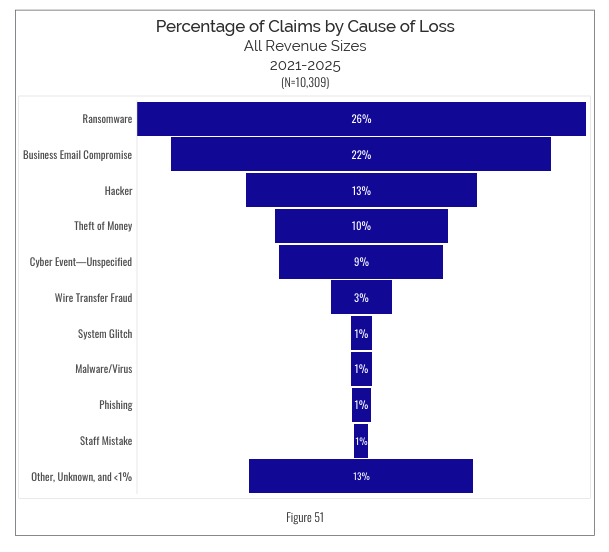
Ransom demands climbed as high as $500 million this year, with actual payments reaching $90 million, and 59 separate incidents involved payments of $10 million or more. These aren’t outlier numbers buried in a footnote. They represent a real and growing tail risk that underwriters and risk managers need to plan for, not just insure around.
Where the Real Costs Add Up
Cost is rarely just the ransom. Three categories in particular continue to push total incident cost higher, well beyond the initial attack.
Business Interruption
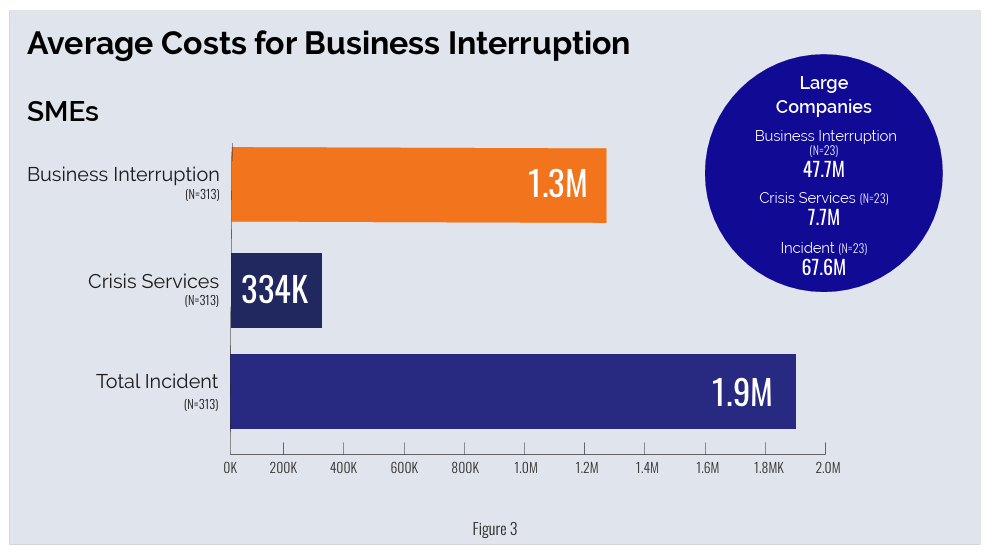
Business interruption (BI) continues to be one of the biggest cost multipliers in the dataset. SME claims involving BI averaged $1.9 million in total incident cost — more than five times the average for claims without it. Ransomware-driven BI claims were even more expensive, averaging $2.3 million. At large companies, the numbers get more extreme still, with five-year average incident cost for BI-involved claims reaching $67.6 million.
Recovery Expenses
Recovery expenses tell a similar story. Claims with a recovery-expense component cost roughly 400% more, on average, than claims without one — a reminder that the cost of getting systems and operations back online is frequently underestimated when organizations budget for cyber risk.
Legal and Regulatory Costs
Legal and regulatory exposure remains concentrated almost entirely at the top of the market. Large companies in the dataset saw average legal costs of $22.2 million, with one settlement alone exceeding $500 million. For SMEs, legal costs are far more modest and far less frequent, but the asymmetry underscores how differently cyber risk shows up depending on where an organization sits on the revenue scale.
What This Means for Insurers, Brokers, and Risk Managers
None of this is meant to be alarmist. It’s meant to be useful. The purpose of the Cyber Claims Study has always been to replace assumption with evidence, and this year’s dataset — the largest and most detailed we’ve published — gives insurers, brokers, and risk managers a clearer picture of where the real cost drivers sit: in ransomware and BEC frequency, in business interruption and recovery costs, and in the small number of very large, very expensive claims that quietly account for more than half of all losses.
The full 2026 NetDiligence® Cyber Claims Study is available now, with a detailed breakdown by sector, cause of loss, company size, and geography.
[Download the full 2026 Cyber Claims Study →]